TURN COMPLEX IDEAS INTO
SHARE-READY VISUALS IN 15 SECONDS ⚡
Do you spend hours creating technical diagrams? (Yes)
Do they still look amateur compared to your expertise? (Yes)
Ready to reclaim your time? Start creating for FREE!
🎉 Limited Beta Access: Create 5 FREE visuals today!
No credit card required • Full features unlocked
No design skills needed → AI handles everything. Consistent branding → Your themes, every visual. API-ready → Integrate with your workflow.
TRY IT NOW - SEE THE MAGIC! ✨
Type what you need below and watch AI create it instantly
No signup needed to try! We'll save your prompt and create your visual after quick signup
🔥 LATEST CREATIONS FROM OUR COMMUNITY
You are given 8 identical balls. One of them is heavier than the rest of the 7(all the others weigh
8/22/2025
This is a lesson from AlgoDaily on mathematics for programming: <visual>The faces on a fair number d
8/22/2025
This is a lesson from AlgoDaily on mathematics for programming: <visual>There is a group of 10 peopl
8/22/2025
This is a lesson from AlgoDaily on mathematics for programming: <visual>Lana has 2 bags with 2 marbl
8/22/2025
🎯 Join DevRel teams from Stripe, Vercel, and GitHub who save 8+ hours/week
💡 Real Result: DevRel teams save 4+ hours per diagram. Perfect for docs, presentations, and stakeholder meetings.
THE EXPERT'S VISUAL BOTTLENECK 😱
You can EXPLAIN complex ideas brilliantly, but turning them into on-brand, technically correct visuals takes forever. We fix that.
Expert Knowledge Trap
"I can explain microservices architecture perfectly, but creating the diagram takes 4 hours and looks amateur..."
Brand Consistency Hell
"DIY ChatGPT + Mermaid still needs Figma wrangling, brand alignment, and raster exports..."
Speed vs Quality
"Fast = ugly templates. Good = expensive designers. Share-ready = impossible timeline..."
WHAT IF THERE WAS A BETTER WAY? 🚀
WHO BUYS: DETAILED PERSONA ATLAS 🎯
DevRel teams, tech influencers, educators, consultants - professionals who can EXPRESS complex ideas but need VISUAL output fast.
DevRel Teams
$140-220k • Company card buyers
"Start Pay-Go to unblock a launch blog → upgrade to $20-$99 when hitting monthly cadence. Our docs stay synced with releases, onboarding dropped 60%."
Tech Influencers
$60-250k • X, YouTube, Substack
"Personal Stripe for spiky bursts around viral threads. Will top-up 1k credits after a hit post. Viral watermark drives horizontal expansion."
Bootcamp Instructors
$90-140k • Quarterly bulk credits
"2k-10k credits timed with cohort start. Cost-per-student optimization drives LMS integration."
Corporate L&D
$150-180k • PO invoice buyers
"Annual $1-2k license with org brand kit & SAML. Security-reviewed, Confluence integrated."
Consultants & Agencies
$180-300/hr • Pass-through billing
"Buy 10k credit packs to bundle into client SOW. Reusable templates across projects."
TECH SPINE: LLM → SMART CAPTURE → PERFECT OUTPUT ⚡
Multi-provider AI → Template/Theme system → Auto-viewport adjustment → Puppeteer → PNG/GIF/MP4 → Supabase CDN. Smart editing with dimension control.
CONSISTENT BRANDING
Upload your brand assets once. Every visual automatically follows your colors, fonts, and style guide.
- AI extracts brand DNA from logos/screenshots
- Auto-apply to all future generations
- Share brand kits with your team
REMIX & BUILD
Start from any public visual. Adapt, modify, and make it yours in seconds.
- One-click "Use as Template"
- Inherit styles and animations
- Track remix lineage & attribution
BULK GENERATION
Generate 100 variations from one template. Perfect for courses, campaigns, and documentation.
- CSV data → Personalized visuals
- API for programmatic generation
- Batch export in all formats
🛡️ Smart Generation & Editing
🎨 Templates & Themes
💰 Simple, Transparent Pricing
📈 Advanced Capabilities
PUBLIC GALLERY: LIVE EXAMPLES 📈
Educational Timeline
Photosynthesis process for biology class - generated in 3 seconds
✅ Student test scores improved 35%
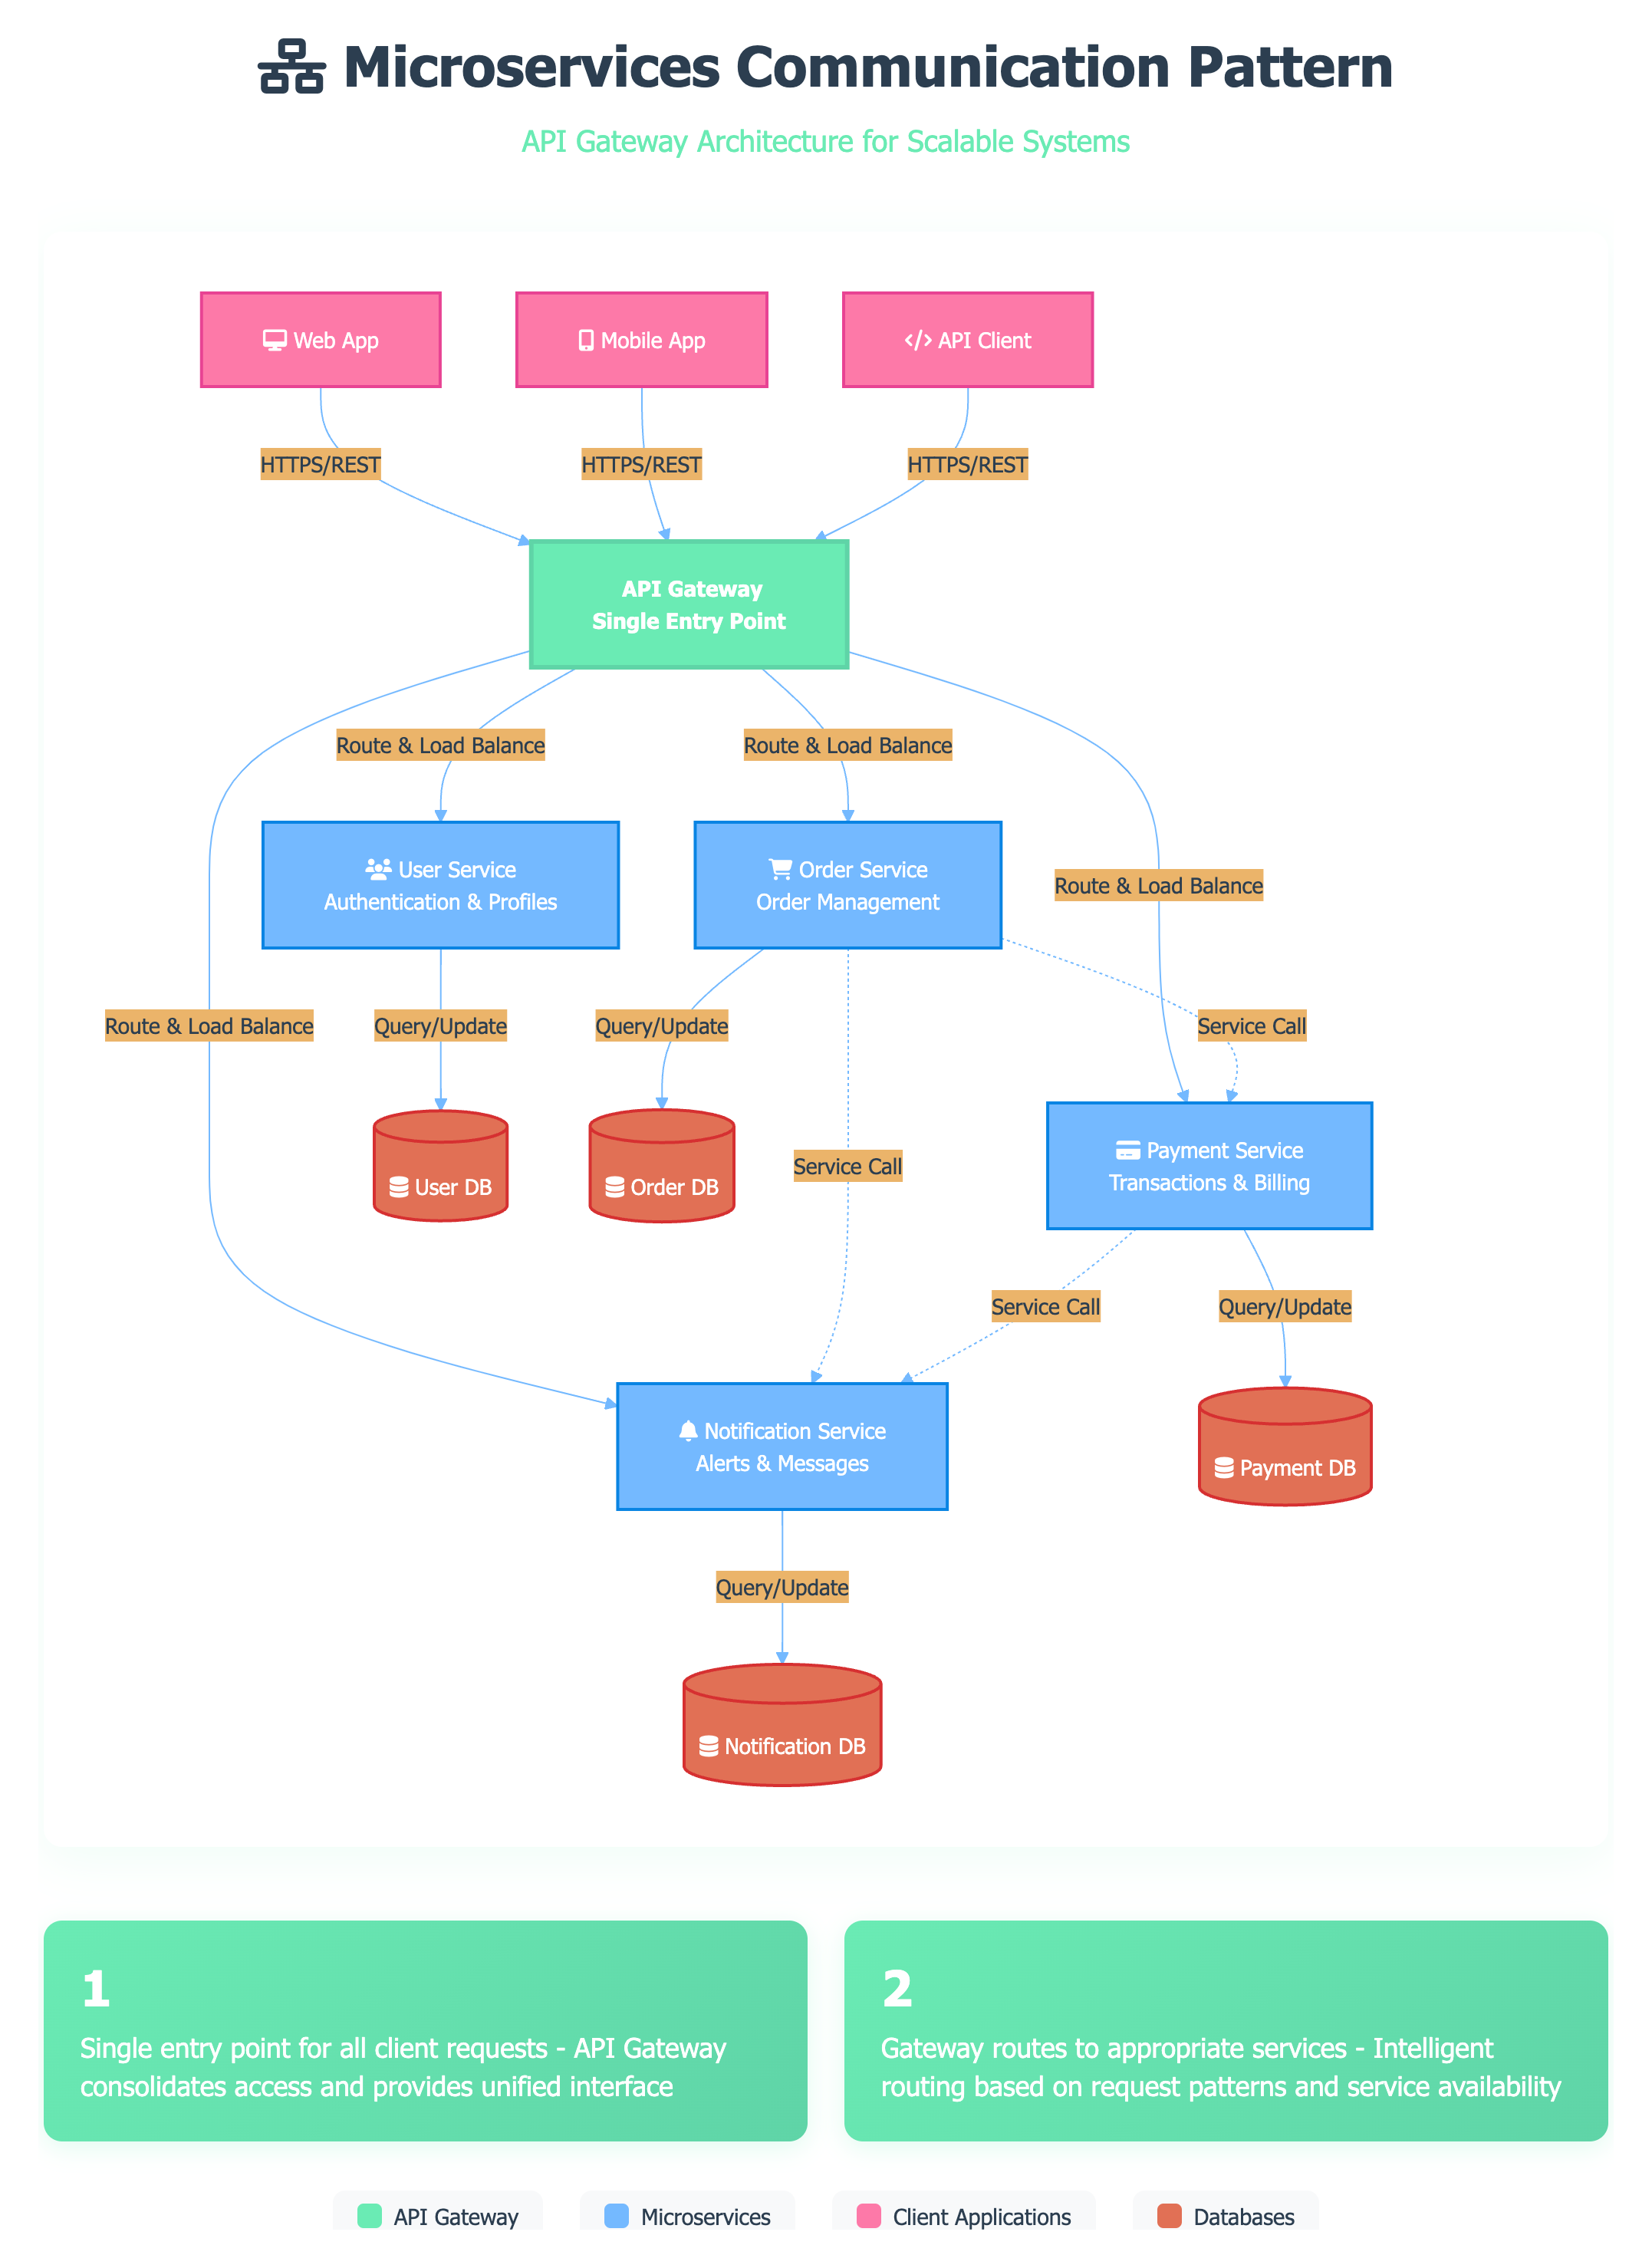
System Architecture
Microservices API gateway pattern - auto-synced with code releases
✅ Developer onboarding 60% faster
Process Flow GIF
How ChatGPT works - viral social media content
✅ 300% engagement increase
🎁 FREE: THE VISUAL CREATION PLAYBOOK
Get our 47-page guide showing how top DevRel teams create docs that developers actually love.
Includes 15 real templates + prompts that work every time.
No spam. Unsubscribe anytime. We'll also send you weekly visual creation tips.
CALCULATE YOUR TIME SAVINGS 💰
See how much VisualizeAnything could save you every month based on your role.
DEVREL ENGINEER
TECH INFLUENCER
CONSULTANT
Adoption pattern: Trigger moment → Swipe card → Realize ROI → Integrate API → Land & expand
Start Creating FREE →TRUSTED BY TOP COMPANIES & UNIVERSITIES 🏆
YOUR NEXT DIAGRAM TAKES 15 SECONDS ⚡
Not 4 hours. Not "after I learn Figma". Not "when the designer is free".
Type what you need → Get professional visual → Ship your project.
Join 2,847 teams who stopped waiting for design help.
Right now: Sarah at Stripe just created 12 API diagrams for their new docs.
Time spent: 3 minutes. Time saved: 48 hours.
No credit card • 10 free visuals • Cancel anytime
🛡️ SOC2 compliant • 📈 99.9% uptime • 🏃 15-second average generation